

THE 2025 INFOTRAK COUNTYTRAK REPORT
CountyTrak Performance Index 2024
A syndicated County Performance Index tracking citizens’ perception of county governments against the devolved functions — covering all 47 counties, 290 constituencies and 1,450 wards of Kenya.
Methodology & Survey Coverage
How the index was built, and where the sample came from
▾
About the Index
“This Index is the first of its kind and magnitude in Kenya. It provides the county governments and other interested stakeholders with robust statistics by ward on the perception of county residents over county governments’ performance of the devolved functions.”
Data Collection
Conducted between October – December 2024 covering all 47 counties, 290 constituencies and 1,450 wards, with an overall sample of 36,200. Each county was treated as an individual universe and assigned a cluster sample ranging between 600 and 2,000 respondents, guided by population and ward count.
Sampling frames within each county were designed using population proportionate to size, guided by census data, and catered for demographics such as age and gender. Data was collected through Computer Assisted Telephone Interviews (CATI) and analysed using SPSS.
How the Index Is Built
The CountyTrak tool consisted of twelve core functions with thirty-three key performance indicators and five approval rating questions, also covering Public Participation, Planning, and Management of County Resources. Residents rated each indicator on a 1–10 Likert scale, where 1 was very poor and 10 was excellent. The mean was computed for each sub-indicator to get the Index for that specific KPI, and the Overall County Performance Index was then computed by taking the average of the KPIs.
The 12 County Functions Covered
Also covered: Public Participation, Planning & Management of County Resources.
Sample Distribution by County
CountyTrak sample size (n) and margin of error at 95% confidence, by county. Search to find your county.
| County | Sample (n) | Margin of Error (±, 95% CI) |
|---|
Perceptions of County Progress
Better, worse or the same as before devolution — and vs. the previous administration
▾
Status of the County
Focusing on development, how would you compare your county of residence now and before the introduction of devolution in 2013?
Status of the County by County, 2024
Search by county.
| County | Better than Before | Worse than Before | Same as Before |
|---|
Comparison of Current & Previous County Government
Still on the same issue of development, how would you compare the current county government and the last county government (2017–2023)?
Current vs. Previous County Government by County, 2024
Search by county.
| County | Better than Previous | Worse than Previous | Same as Previous |
|---|
2024 Function Performance Rankings
How each of the 12 devolved functions ranked and rated, 2015–2024
▾
Using a scale of 1–10, where 1 is extremely poor and 10 is excellent, how would you rate your county government’s performance with regard to each devolved function? Sorted by 2024 rating.
| Function | Rank 2024 | Rating 2024 | Rank 2023 | Rating 2023 | Rank 2020 | Rating 2020 | Rank 2015 | Rating 2015 |
|---|
Overall CountyTrak Index 2024: 43% (2023: 49%, 2020: 47%, 2015: 56%).
Performance by County Function
County-level rankings, 2024 rating and most-improved counties for all 12 functions
▾
Agriculture
- Making it easy for farmers to grow and sell their crops, livestock or fish
- Making food more accessible and affordable to you and your family
- Ensuring there is proper management of livestock diseases (foot and mouth, anthrax, Newcastle disease, rabies etc.) and disposal of dead animals
Mean Index 2024: 43%
| Rank 2024 | County | Mean Index 2024 |
|---|
Most improved counties, 2023 → 2024 (points gained):
Health
- Making it easier for you and your family to get good quality & affordable medical treatment when you need it
- Ensuring county health facilities are well equipped with medical personnel, equipment and medicine
- Ensuring that you receive information on how to stay healthy and avoid diseases
- Ensuring there are adequate sanitation facilities (pit latrines, public toilets) in your area
Mean Index 2024: 42%
| Rank 2024 | County | Mean Index 2024 |
|---|
Most improved counties, 2023 → 2024 (points gained):
Education
- Ensuring there are enough Nursery/ECD centres in your area with good facilities & teachers
- Ensuring there are enough village polytechnics/County Technical Training Institutes with good facilities and instructors
- Ensuring needy, vulnerable and gifted/talented children receive bursaries fairly
Mean Index 2024: 46%
| Rank 2024 | County | Mean Index 2024 |
|---|
Most improved counties, 2023 → 2024 (points gained):
Roads & Transport
- Improving and maintaining road networks within your locality (new roads, grading/maintenance, culverts/bridges)
- Ensuring public transport (matatus, buses, taxis, boda bodas) is well organised and traffic well managed
- Installing and maintaining street lighting in county urban and market areas
Mean Index 2024: 42%
| Rank 2024 | County | Mean Index 2024 |
|---|
Most improved counties, 2023 → 2024 (points gained):
Energy
- Ensuring access to affordable energy for lighting and cooking (electricity, gas, kerosene, etc.)
- Promoting the use of clean energy sources such as wind, solar, biogas etc.
Mean Index 2024: 44%
| Rank 2024 | County | Mean Index 2024 |
|---|
Most improved counties, 2023 → 2024 (points gained):
Trade & Tourism
- Increasing trade in your county through the development of markets
- Reducing the cost of doing business through incentives such as lower taxation and levies
- Ensuring trade licenses are issued in a simple manner; promoting cooperative societies/SACCOs
- Attracting investment and promoting local tourism through hotels, resorts and tourist sites
Mean Index 2024: 42%
| Rank 2024 | County | Mean Index 2024 |
|---|
Most improved counties, 2023 → 2024 (points gained):
Housing, Lands & Settlement
- Resolving land disputes
- Facilitating issuance of title deeds to county residents
- Ensuring the urban areas in your county are well organised
Mean Index 2024: 42%
| Rank 2024 | County | Mean Index 2024 |
|---|
Most improved counties, 2023 → 2024 (points gained):
Water Management & Sanitation
- Ensuring access to clean and safe water whenever you need it
- Constructing and maintaining drainage systems and sewer systems in towns and urban centres
- Ensuring proper garbage collection, management and disposal
- Ensuring the county is well prepared to manage fires, accidents, floods & other calamities
Mean Index 2024: 43%
| Rank 2024 | County | Mean Index 2024 |
|---|
Most improved counties, 2023 → 2024 (points gained):
Environment & Natural Resources
- Protecting and conserving county natural resources such as forests and water resources
- Actively involving residents in environmental conservation e.g. tree planting and gabion building
Mean Index 2024: 46%
| Rank 2024 | County | Mean Index 2024 |
|---|
Most improved counties, 2023 → 2024 (points gained):
Culture & Sports
- Promoting the establishment of recreational parks, beaches & recreational facilities
- Promotion of county cultural activities and facilities
- Promoting sports through stadia and support for county sports activities
- Establishing and maintaining county museums and libraries
Mean Index 2024: 43%
| Rank 2024 | County | Mean Index 2024 |
|---|
Most improved counties, 2023 → 2024 (points gained):
Social Services
- Women: entrepreneurship & leadership training, women cooperatives
- Youth (18-35yrs): empowerment activities to alleviate unemployment
- PLWDs and OVCs: empowerment activities and support mechanisms for orphans & vulnerable children
- The elderly (over 65): ensuring they are well looked after & supported financially
Mean Index 2024: 46%
| Rank 2024 | County | Mean Index 2024 |
|---|
Most improved counties, 2023 → 2024 (points gained):
County Planning & Development
- Developing county plans that take into consideration residents’ needs and desires
- Educating and involving county residents in the preparation of county development plans
Mean Index 2024: 43%
| Rank 2024 | County | Mean Index 2024 |
|---|
Most improved counties, 2023 → 2024 (points gained):
Overall County Status Index (CSI) & Leadership
Top-ranked counties, most improved, and the governors leading them
▾
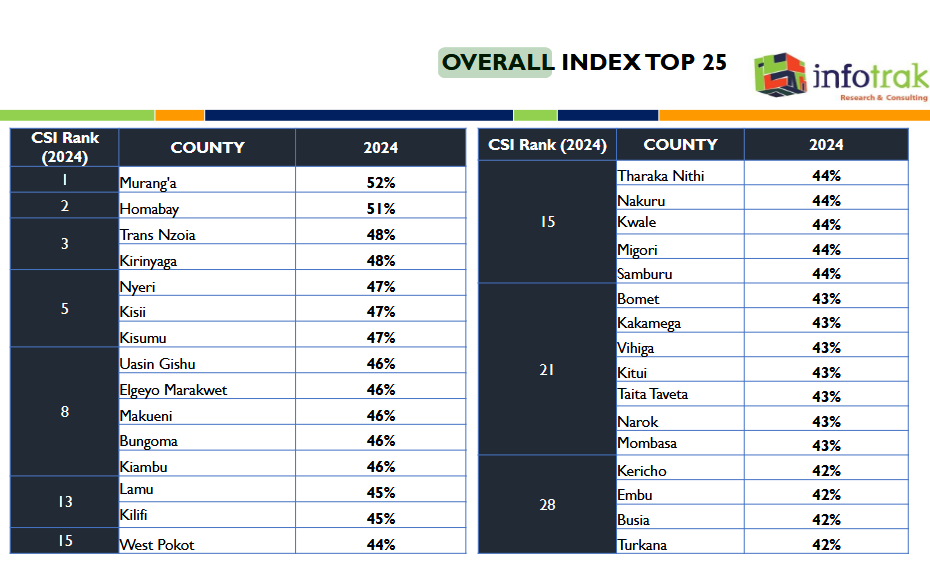
Overall Index Top Counties, 2024
Composite CSI rank across all 12 devolved functions. Search by county.
| CSI Rank 2024 | County | CSI 2024 |
|---|
Most Improved Counties, CSI 2023 → 2024
| Position | County | Rank 2023 | Rank 2024 | Change in Ranks |
|---|
Reasons for Decline in Performance of County Governments
Over the past 10 years, county governments have progressively received lower performance ratings. In your opinion, what are the main reasons for this decline?
Top Counties by Year
CSI rank, index and governor at the time, by survey year.
2015
2020
2023
2024
Repeat & Second-Term Governors in the Top 25 (2024)
Repeat Governors
Second-Term Governors
Women-Led Counties in the Top 25 (2024)
| Rank 2024 | County | Governor | Index 2024 |
|---|
Public Participation
Also assessed: how counties involve residents in planning & management of resources
▾
County-level index on public participation in planning and management of county resources. Search by county. Average across all counties: 46%.
| Rank | County | Index |
|---|

Leave a Reply
You must be logged in to post a comment.