


THE INFOTRAK VOICE OF THE PEOPLE POLL RELEASE! JUNE 2024
Voice of the People Poll
A nationally representative CATI poll of 1,700 adult Kenyans across all 47 counties, fielded 23rd–29th May 2024.
Methodology
Data Collection
Quantitative interviews were conducted through Computer Assisted Telephone Interviews (CATI) between 23rd–29th May 2024.
The survey sample achieved was 1,700, representing the universe of adult Kenyans aged 18 years and above. The sampling frame was designed using Population Proportionate to Size (PPS), guided by the 2019 Census.
Margin of error was ±2.53% at a 95% degree of confidence, with a 92% response rate.
Where achieved interviews differed slightly from the intended sampled proportions per demographic group, the dataset was weighted to correct for over- or under-sampling, ensuring the sample was proportionately representative of the target population.
The survey covered all 47 counties and 8 regions of Kenya, with the sample proportionately allocated across regions.
Data was processed and analyzed using SPSS 26 statistical software.
| Region | Adult Population (Millions) | Regional % | Sample Achieved |
|---|---|---|---|
| Coast | 2.3 | 9% | 153 |
| North Eastern | 1.0 | 4% | 68 |
| Eastern | 3.9 | 15% | 255 |
| Central | 3.4 | 13% | 221 |
| Rift Valley | 6.6 | 26% | 442 |
| Western | 2.5 | 10% | 170 |
| Nyanza | 3.2 | 12% | 204 |
| Nairobi City | 2.9 | 11% | 187 |
| Total | 25.7 | 100% | 1700 |
Direction of the Country
A majority of respondents (63%) said the country is headed in the wrong direction, with only 19% saying it is headed in the right direction.
Dissatisfaction has grown over the past year: previous InfoTrak polls conducted in February 2023 and August/September 2023 put the wrong-direction figure at 62% and 53% respectively.
Among regions saying the country is headed in the wrong direction, Nairobi was highest at 74%, followed by Eastern (69%) and Nyanza (68%).
64% of respondents aged 27-35 and 65% of those aged 45-50 said the country needs to move toward the right direction.
The leading reasons cited for the country heading in the wrong direction were the high cost of living (45%) and high taxes (27%).
Among those who said the country is headed in the right direction, the economy doing well was the top reason cited in the May 2024 poll, at 31%.
| Wave | Right Direction | Neither Right Nor Wrong | Wrong Direction | Don't Know/Refused |
|---|---|---|---|---|
| Feb-23 | 22% | 16% | 62% | 2% |
| Sept 2023 | 30% | 15% | 53% | 3% |
| May-24 | 19% | 16% | 63% | 2% |
| Region | Right Direction | Wrong Direction | Neither Right Nor Wrong | Don't Know/Refused |
|---|---|---|---|---|
| Coast | 21% | 61% | 16% | 2% |
| North Eastern | 22% | 47% | 31% | – |
| Eastern | 17% | 69% | 12% | 1% |
| Central | 20% | 63% | 16% | 0.5% |
| Rift Valley | 23% | 54% | 20% | 3% |
| Western | 21% | 64% | 13% | 2% |
| Nyanza | 16% | 68% | 15% | 1% |
| Nairobi | 7% | 74% | 17% | 2% |
| Total | 19% | 63% | 16% | 2% |
Why do you think that the country is going in the right direction? (May 2024)
Why do you think that the country is going in the wrong direction? (May 2024)
Key Issues of Concern
The cost of living was the leading issue of concern among Kenyans at 49%, followed by unemployment (30%) and transport, infrastructure and roads (22%). Other issues raised were the cost of doing business (19%) and access to healthcare (19%).
Cost of living and unemployment have been the prevalent, recurring issues of concern in every poll conducted since August/September 2023 and February 2023.
Nyanza had the highest share of respondents citing cost of living as a key concern (60%); Coast, North Eastern, Nairobi, Central, Rift Valley, Western and Eastern all scored below the national average.
By gender, 50% of male respondents cited cost of living as a key issue, similar to 50% of youth aged 18-26; 47% of female respondents cited the same issue.
32% of male respondents cited unemployment as a key concern, compared with 29% of female respondents.
Top issues of concern (May 2024)
| Issue | Feb 2023 | Aug/Sept 2023 | May 2024 |
|---|---|---|---|
| Cost of living / High cost of living | 72% | 65% | 49% |
| Unemployment | 30% | 37% | 30% |
| Quality of education / Affordable quality education | 25% | 17% | 13% |
| Agriculture | 19% | 16% | 18% |
| Insecurity/crime | 14% | 9% | 11% |
| Poverty reduction | 14% | 8% | 10% |
| Access to clean water | 13% | 12% | 6% |
| Cost of doing business | 12% | 13% | 19% |
| Transport, Infrastructure and Roads | 12% | 15% | 22% |
| Access to healthcare | 11% | – | 19% |
| Corruption | 11% | 15% | 13% |
| Youth empowerment | 8% | 8% | 9% |
| CDF funds and bursaries allocation | 7% | – | 4% |
| HELB loan allocation | 6% | – | – |
| Bad Politics | 5% | 8% | 4% |
| Disaster management e.g. floods | 5% | – | 5% |
| Equal distribution of resources | 4% | 4% | 4% |
| Empowerment of women and the youth | 4% | 7% | 4% |
| Ethnicity/Tribalism | – | 2% | – |
| Others | 16% | 15% | 20% |
| Issue | Coast | North Eastern | Eastern | Central | Rift Valley | Western | Nyanza | Nairobi | Total |
|---|---|---|---|---|---|---|---|---|---|
| Cost of living | 48% | 42% | 47% | 48% | 48% | 48% | 60% | 46% | 49% |
| Unemployment | 29% | 24% | 30% | 32% | 26% | 35% | 34% | 33% | 30% |
| Transport, Infrastructure and Roads | 17% | 27% | 28% | 20% | 22% | 19% | 21% | 23% | 22% |
| Cost of doing business | 16% | 19% | 17% | 25% | 19% | 20% | 18% | 22% | 19% |
| Access to healthcare | 23% | 15% | 17% | 16% | 18% | 26% | 22% | 19% | 19% |
| Agriculture | 15% | 12% | 12% | 21% | 24% | 24% | 19% | 17% | 18% |
| Corruption | 14% | 3% | 18% | 12% | 12% | 13% | 12% | 14% | 13% |
| Quality of education | 17% | 15% | 13% | 13% | 10% | 13% | 14% | 17% | 13% |
| Insecurity/crime | 13% | 15% | 9% | 8% | 14% | 10% | 9% | 10% | 11% |
| Poverty reduction | 14% | 10% | 6% | 7% | 12% | 8% | 13% | 9% | 10% |
| Youth empowerment | 9% | 5% | 11% | 13% | 10% | 7% | 4% | 9% | 9% |
| Access to clean water | 5% | 25% | 6% | 2% | 7% | 4% | 7% | 9% | 6% |
| Disaster management e.g. floods | 10% | 7% | 4% | 1% | 6% | 3% | 7% | 7% | 5% |
| High Taxation | 4% | 3% | 6% | 7% | 2% | 3% | 5% | 8% | 5% |
| Bad Politics | 5% | – | 4% | 5% | 3% | 7% | 7% | 4% | 4% |
| Empowerment of women & the youth | 5% | 5% | 4% | 6% | 2% | 4% | 2% | 6% | 4% |
| Environmental conservation | 5% | 2% | 3% | 5% | 3% | 6% | 3% | 4% | 4% |
| Equal distribution of resources | 1% | 7% | 4% | 5% | 4% | 2% | 4% | 4% | 4% |
| CDF funds and bursaries allocation | 2% | – | 6% | 2% | 5% | 4% | 2% | 2% | 4% |
| Public participation | 3% | 2% | 3% | 2% | 3% | – | 4% | 4% | 3% |
| Others | 17% | 17% | 21% | 22% | 18% | 16% | 21% | 23% | 20% |
Finance Bill 2024
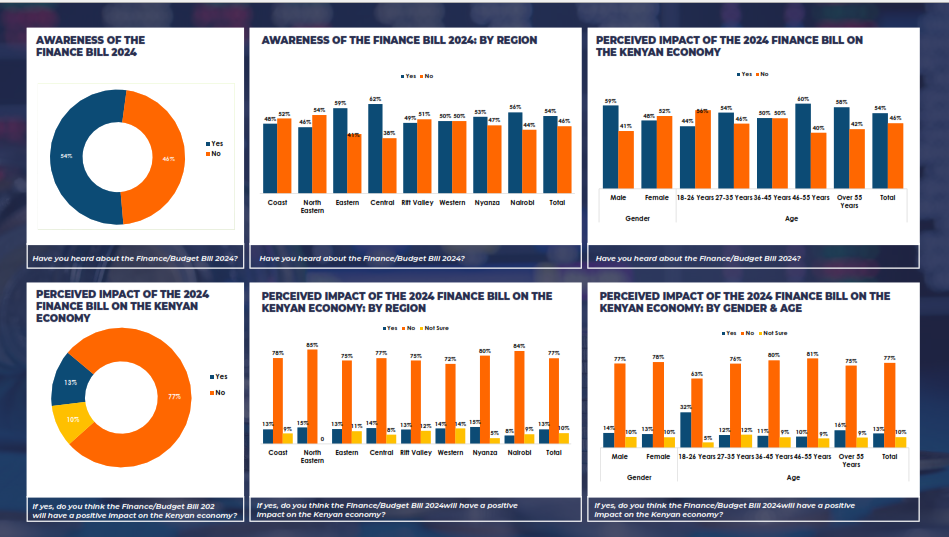
54% of respondents said they were aware of the Finance Bill 2024, while 46% said they were not.
Central region had the highest awareness (62%), followed by Eastern (59%); North Eastern had the lowest awareness (46%).
Male respondents were more aware of the Bill than female respondents (59% vs 41%).
Adults aged 46-55, often more engaged in financial matters, were the most aware of the Bill, at 60%.
Among the 918 respondents aware of the Bill, 77% said it would have no impact on Kenya's economy, 13% said it would have a positive impact, and 10% were not sure. In North Eastern, 85% said it would have no impact.
Adults aged 36-45 (80%) and 46-55 (81%) were most likely to say the Bill would have no impact on the economy.
87% of respondents opposed the proposed 16% VAT on bread, and 86% opposed the proposed 16% VAT on financial and insurance services/transactions such as M-Pesa.
83% opposed the proposed additional levy on environmentally unfriendly products such as batteries, tyres, phones and ICT equipment.
North Eastern had the highest regional support for the proposed 2.5% motor vehicle tax, at 14%, compared with a national average of 8%.
9% of male respondents and 7% of female respondents supported the motor vehicle tax proposal.
14% of youth aged 18-26 supported the additional levy on environmentally unfriendly products, compared with 5% of respondents aged 36-45 and 5% of those aged 46-55.
3% of female respondents supported the 16% VAT on bread and 3% supported the 16% VAT on financial and insurance services; 3% of adults aged 36-45 supported the tax on financial and insurance services.
| Region | Yes | No |
|---|---|---|
| Coast | 48% | 52% |
| North Eastern | 46% | 54% |
| Eastern | 59% | 41% |
| Central | 62% | 38% |
| Rift Valley | 49% | 51% |
| Western | 50% | 50% |
| Nyanza | 53% | 47% |
| Nairobi | 56% | 44% |
| Total | 54% | 46% |
| Region | Yes | No | Not Sure |
|---|---|---|---|
| Coast | 13% | 78% | 9% |
| North Eastern | 15% | 85% | 0% |
| Eastern | 13% | 75% | 11% |
| Central | 14% | 77% | 8% |
| Rift Valley | 13% | 75% | 12% |
| Western | 14% | 72% | 14% |
| Nyanza | 15% | 80% | 5% |
| Nairobi | 8% | 84% | 9% |
| Total | 13% | 77% | 10% |
| Tax Measure | Yes | No | Not Sure/Don't Know |
|---|---|---|---|
| Introduction of motor vehicle tax of 2.5% of the value of the vehicle, collected by the insurer | 8% | 81% | 11% |
| Additional levy on environmentally unfriendly products such as batteries, tyres, phones and ICT equipment | 6% | 83% | 11% |
| Proposal to exempt disclosure of personal data by data controllers/processors for tax or duty assessment | 5% | 83% | 12% |
| 16% VAT on financial and insurance services/transactions like M-Pesa | 4% | 86% | 10% |
| 16% VAT on Bread | 3% | 87% | 10% |
| Tax Measure (% Yes) | Coast | North Eastern | Eastern | Central | Rift Valley | Western | Nyanza | Nairobi | Total |
|---|---|---|---|---|---|---|---|---|---|
| Motor vehicle tax of 2.5% of value, collected by insurer | 7% | 14% | 12% | 7% | 6% | 11% | 4% | 7% | 8% |
| Additional levy on environmentally unfriendly products | 7% | 7% | 7% | 5% | 4% | 8% | 5% | 7% | 6% |
| Exempt disclosure of personal data for tax/duty assessment | 5% | 3% | 7% | 5% | 3% | 6% | 4% | 5% | 5% |
| 16% VAT on financial and insurance services/M-Pesa | 5% | 3% | 5% | 1% | 4% | 4% | 2% | 4% | 4% |
| 16% VAT on Bread | 2% | 5% | 4% | 2% | 4% | 4% | 1% | 2% | 3% |
Poll Demographics
Age
Level of Education
Employment
About InfoTrak Research & Consulting
InfoTrak Research and Consulting is a professional research company founded and incorporated under the Laws of Kenya in 2004, following the vision of the founder to provide the Pan African market with information solutions to sustain the needs of the ever-growing economies.
Headquartered in Nairobi, Kenya, InfoTrak also has affiliate offices in Lagos, Nigeria, and field contacts in more than 20 other countries in Sub-Saharan Africa.
Providing support to various organisations in the private and public sector over the last 16 years, InfoTrak attributes its continuous growth not only to innovation, professionalism and dynamism, but also to the intricate attention given to providing clients with relevant, user-friendly reports.
Vision
To be the leading Market & Social research firm in Sub Saharan Africa.
Mission
To be a one stop, information solutions provider to clients who want to be leaders in their fields.
Belief
Information is power. Only those who really know how to use it become truly powerful. At InfoTrak, we place the power of information in your hands!
Testimonial
InfoTrak has proven to be an integral and reliable partner not only in providing business solutions but also governance & public policy insights.

Leave a Reply
You must be logged in to post a comment.